
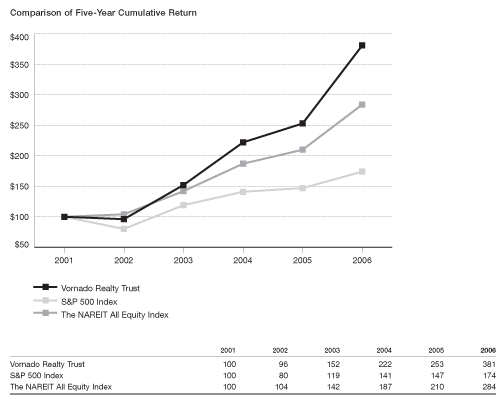
Performance Graph
The following graph is a comparison of the five-year cumulative return of our common shares, the Standard & Poor's 500 Index (the "S&P 500 Index�) and the National Association of Real Estate Investment Trusts' ("NAREIT") All Equity Index (excluding health care real estate investment trusts), a peer group index. The graph assumes that $100 was invested on December 31, 2001 in our common shares, the S&P 500 Index and the NAREIT All Equity Index and that all dividends were reinvested without the payment of any commissions. There can be no assurance that the performance of our shares will continue in line with the same or similar trends depicted in the graph below.
|